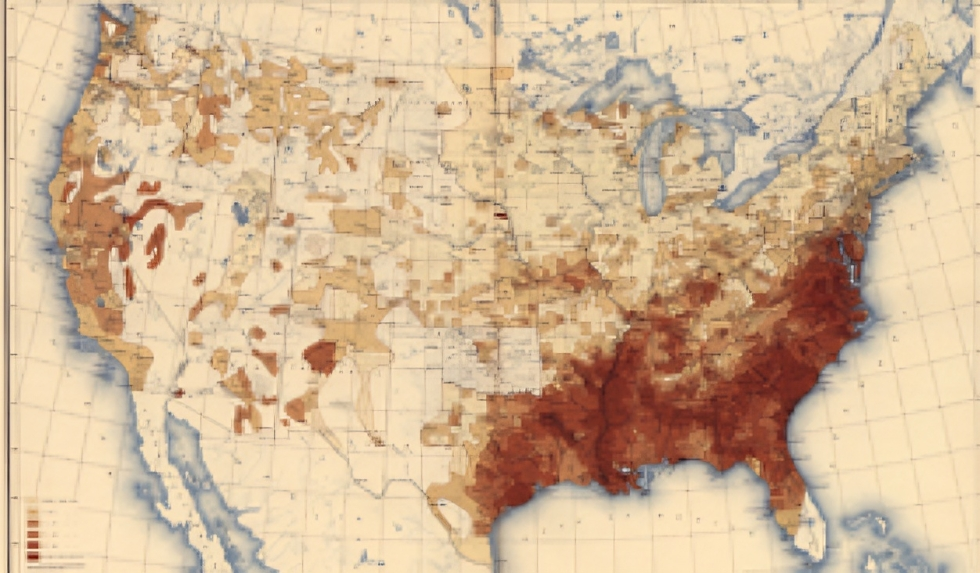
Published in the 1890 Statistical Atlas of the United States, this map represents the relationship between white and non-white populations “including all persons of Negro descent, Chinese, Japanese, and civilized Indians,” according to statistics from the 1890 census. The darker shading indicates higher percentages of non-white population in relation to the white population of the United States.
Henry Gannett was a prominent American geographer and statistician in the late 19th and early 20th centuries. He played a significant role in the development of statistical and cartographic methods for analyzing and presenting demographic and geographic data.
One of his notable works is the “Statistical Atlas of the United States, Based upon the Results of the Eleventh Census,” published in 1898. This atlas is a comprehensive and visually engaging presentation of data from the 1890 census, offering a range of maps and charts that illustrate various aspects of American life at the time, including population distribution, economic activities, and social conditions.
The atlas was groundbreaking for its use of statistical graphics to represent complex data in an accessible format. Gannett’s work in this publication helped to popularize the use of maps and charts in the field of statistics and geography, setting a precedent for future demographic and geographic studies.
In addition to his work on the Statistical Atlas, Gannett was involved in various other projects and roles, including serving as a geographer for the U.S. Geological Survey and contributing to the development of geographic and statistical standards. His contributions have had a lasting impact on the fields of geography and statistics.